18 Ways I Create Bar Charts in Tableau | Tableau Tutorial

15:28
Create 10 ACTIONABLE & IMPACTFUL KPIs in Tableau

16:28
Build the ULTIMATE Tableau Dashboard from Scratch

19:12
How to create rounded progress bar chart in tableau

10:55
How To Create these useful Power Bi Visuals that Excel Lacks

10:47
#Tableau - Create a Full Year Calendar Heatmap

11:58
Blue vs. Green - What does it mean in Tableau?
42:32
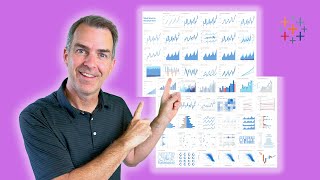
60 Unique Ways to Visualize Time in Tableau

22:26