Draw Scatterplots & Determine Correlation (Positive & Negative Correlation of Data) - [8-9-1]

33:56
Equation of Line of Best Fit - Statistics & Data Analysis - [8-9-7]

11:03
Correlation and Causation

19:14
Lesson 1 - Learn Scatter Plots in Statistics

5:18
How to Draw a Scatter Diagram Step By Step ? | Positive and Negative Correlation Explained.

13:48
How To Learn Any Skill So Fast It Feels Illegal

27:00
Correlation Analysis - Full Course in 30 min
21:53
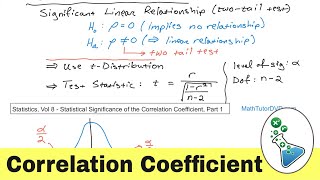
Statistical Significance & the Correlation Coefficient

14:56